General guidance for Graphic Charts and Complicated Images on the University of Maine System Website
What are complicated images?
Graphic charts, such as pie charts, flow charts or bar graphs, and other complicated images pose a unique challenge to accessibility as the information in these complicated images cannot be fully conveyed in under 125 characters, thus making it not possible to simply describe the image in the alt text. All information conveyed in a graphic chart or complicated image must be available in an alternative text format in order to be made accessible.
Thus, graphic charts and complicated images take additional time and effort to make accessible for the web. Editors should take extra consideration in determining which graphic charts and complicated images are needed, or when a text-based option may be equally effective. Please reach out to the content management team if you need assistance determining appropriate accessible approaches to your graphic charts and complicated images.
How can I include complicated images in my content?
The short answer is that you must explicitly describe all of the data being conveyed in a complicated image in what is called an “image description,” because alt text does not allow enough characters to describe complicated data. Simply put: the information must be described in words in detail.
Below you will find instructions on how to include accessible complicated images in your content on the University of Maine System website.
Examples of providing alternative text for graphic charts and complicated images
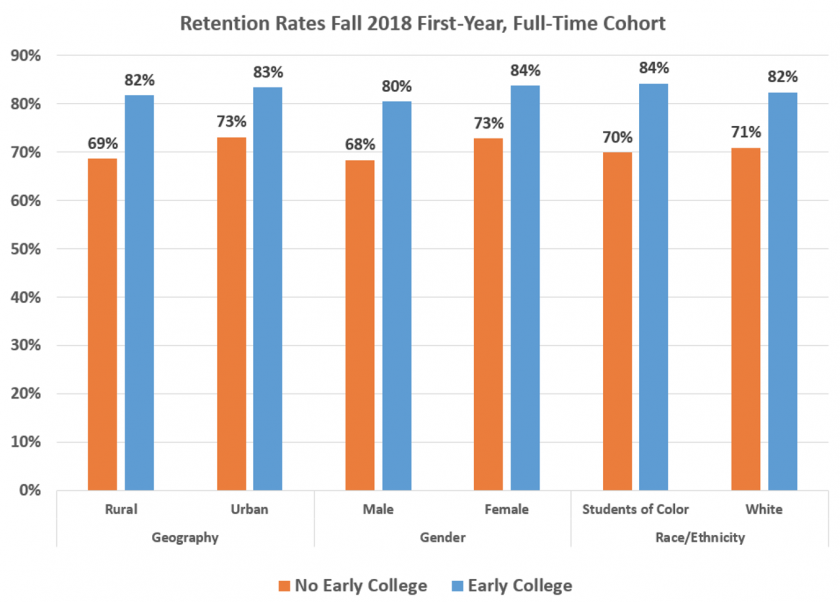
For the following examples of an acceptable method for providing alternative text format for graphic charts and complication images we will reference the following bar chart (figure 1):
Incorrect examples
Example of an incorrect approach to providing alternative text for graphic charts and complication images – chart title as alt text
An incorrect approach to providing alternative text for the above graph would be to only include the title of the graph. An incorrect approach to providing alternative text for the above graph would be to only include the title of the graph in Figure 1, “Fall 2018 First-Year, Full-Time Cohort Bar Graph,” in the alt text of the image. This does not provide an effective alternative for a user utilizing assistive technology (such as a screen reader) with the information conveyed in the graph—“Fall 2018 First-Year, Full-Time Cohort Bar Graph”—in the alt text of the image. This does not provide an effective alternative for a user utilizing assistive technology such as a screen reader because the information conveyed in the graph is not described.
Example of an incorrect approach to providing alternative text for graphic charts and complication images – chart summary as alt text
Additionally, it is incorrect to have a summary of the graph in Figure 1 as the image alt text, for example “Graph showing students with Early College have higher retention rates.” This also does not provide an effective alternative for a user utilizing a screen reader with the information conveyed in the graph that would be accessible to a sighted user, such as the year the date is from, the demographics included and the individual data points.
Correct examples
Example of a correct approach to providing alternative text for graphic charts and complication images – all information conveyed in page body text
One approach to providing an accessible graph or complicated image is to include all information from the graphic chart or complicated image in the accompanying text on the page body. To do this, you would include a caption for your image identifying the image for reference in the text. For example, you could caption the previous graph as ‘Figure 1,” seen here:
In this example the alt text would read “Figure 1 – Fall 2018 First-Year, Full-Time Cohort Bar Graph – See below for description.” The text below the image would read:
The Fall 2018 First-Year, Full-Time Cohort Bar Graph, seen in figure 1 above, shows the first year retention rates for the 2018 first-year, full-time cohort for both student who participated in early college and student who did not participate in early college in the following demographics:
- Geography: Rural
- Geography: Urban
- Gender: Male
- Gender: Female
- Race/Ethnicity: Students of Color
- Race/Ethnicity: White
The graph in Figure 1 shows that the overall demographics of students who participated in early college persisted at a higher rate than students who did not participate in early college. Rural students with early college experience persisted at 82% versus rural students without early college experience at 69%. Urban students with early college experience persisted at 83% versus urban students without early college experience at 73%. Male students with early college experience persisted at 80% versus male students without early college experience at 68%. Female students with early college experience persisted at 84% versus female students without early college experience at 73%. Students of color with early college experience persisted at 84% versus female students of color without early college experience at 70%. White students with early college experience persisted at 82% versus female students of color without early college experience at 71%.
Note: Captions and alt must be added using the Media Library or editing the Image Details. Learn more about how to use these features on the Add Media page.
Example of correct approach to providing alternative text for graphic charts and complication images – all information conveyed on separate page linked in caption
Another acceptable approach to providing an accessible graph or complicated image is to include all information from the graphic chart or complicated image on a separate page linked in the image caption. To do this, you would include a caption for your image identifying that the caption is a link to the alt text for that image. For example, you would caption the previous graph as “Text-only Description for Retention Rates Fall 2018 First-Year, Full-Time Cohort bar graph,” seen here:
In this example the alt text would read “Fall 2018 First-Year, Full-Time Cohort Bar Graph – Text-only description linked below.”
Next, you will create a new page title “Text-only Description for Retention Rates Fall 2018 First-Year, Full-Time Cohort bar graph” where you will include the full text-only description of both the presentation and data in presented in the graphic chart or complicated image. It is best practice to include a link back to the page in which the graphic chart or complicated image is found. Once your text-only description page is created, link this page to the caption text of your image. Learn more about adding links here.
Note: Captions and alt text must be added using the Media Library or editing the Image Details. Learn more about how to use these features on the Add Media page.